The Ministry of the Walloon Region needed some guarantee about the realism of such an inventive model before using it for regulatory purpose.
No large scale release could be envisaged in a country as inhabited as Belgium and the only way to assess the validity of the linked models was assessing the validity of each module.
Validation of the SOURCE modules top
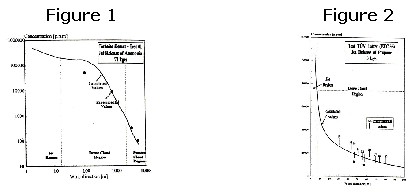
The various modules of SOURCE were validated by comparing computation results to experimental measurements or accidental damages. Le modèle de vapeur dense a été compare aux résultats expérimentaux des expérimentations Tortoise Desert (ammoniac Fig.1) et les expérimentations Latten (Propane Fig.2).
The dense cloud model has been compared to the experimental results of the Tortoise Desert experiments (ammonia release - Fig. 1) and the Latten experiments (propane release - Fig. 2).
Validation of the MESO-module top
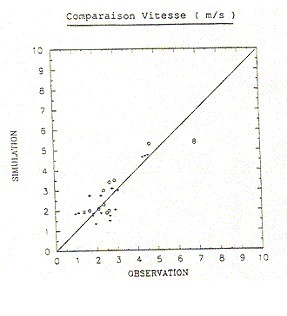
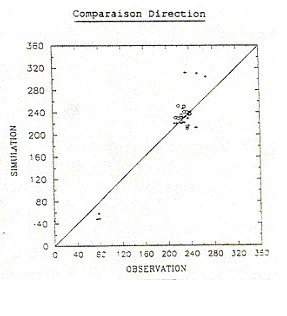
Calculated wind speeds and wind directions were compared to measurements in two different places of the same simulated wind field. Three hilly sites were chosen and for each of them comparisons were made between the conditions above the plateau and at 10 m above the bottom of the valley.
In stable and neutral conditions the difference between calculations and measurement were rather small. No comparison was possible in unstable conditions as the results were too scattered. This was not a real problem because unstable conditions are favourable for the dispersion and SEVEX is only interested in the worst conditions.
The Fig. 3 show the comparison between calculated and observed wind speed and wind direction in Jemeppe-sur-Sambre (in the valley) and Temploux (on the plateau).
Validation of the Lagrangian dispersion model top
Comparison were made with data from the Karlsruhe's experiments performed in 1977. Wind fields were simulated with the same geostrophical wind and the releases had the same flow rates.
In order to assess the reliability of the methodology, isopleth were plotted with an increasing ratio of 1; 3; 10 and the sensor where the measured concentration does not exceed the calculated one were counted as valid results and those where the measured concentration exceeded the calculated one was counted as defaults.
Based on 8 experiments and about 250 concentration data the reliability of the model is assessed. The percentages of valid simulated concentrations vary from about 90 % to 99 % when a safety coefficient of 3 is applied.
Product of ATM-PRO sprl & Lakes Environmental Software Inc.