


- Input Options
- Footprint results
- Puff Results
- XY Graph
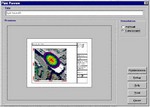
- Print Preview
Introduction top
Some sample windows about :

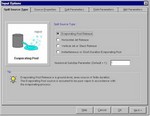
1. Input options top
SLAB view provides an easy-to-use interface for describing the type of release that you are modeling. In addition to lots of tips and context sensitive help, SLAB view provides you with a set of Property Estimators that help take the guess work out of many of the input parameters. Additionally, SLAB view comes with an extensive database of toxic materials that will save you time and make your modeling project easier.
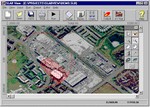
2. Footprint results top
If you enter the concentration level and the wind direction, SLAB view can automatically generate "footprints" showing the area of impact from a toxic release. Transparent footprints, such as this one can be used to show areas of impact without obscuring features such as buildings.
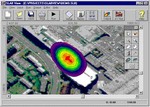
3. Puff Results top
In addition to displaying the area impacted by a release, SLAB view can show the specific area of impact at a particular point in time after the release. You are provided with full control over contour shading, transparency, labeling, etc. for these time dependent puffs.
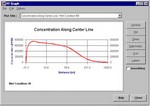
4. XY Graph top
SLAB view can produce XY plots that show the maximum concentration along the center-line of the toxic release. These plots are fully customizable to allow you to change axis labels, fonts, colors and graph type.
5. Print Preview top
The output can be customized to allow you to enter your own title, your company name and place your own name on the printed output. SLAB view provides report quality output to a wide variety of printers and can be produced in both landscape and portrait formats. The built-in print preview mode shows you exactly what your plot will look like before you print, saving you time, frustration, and paper.
top
Product of Lakes Environmental Software Inc.