


Introduction top
The energy production is one of the major challenges of our modern society which is in front of global pollution problems and the global climatic change. In such a context the "Green" energy production has the wind in its sails !
Many Regions, together with the state and International levels, engaged themselves within programs of reduction of greenhouse gases emissions and programs of RENEWABLE ENERGIES development in order to achieve a sustainable development. This results into long term regional policies and into a coherent strategy integrating a quantification of the « regional potential » to use the various sources of renewable energy .
Among the various technological solutions respectful of the environment the wind turbines are of great interest because they are not polluting. Besides a low operating costs, the feeling of the people about such installations is relatively good. This can induce some positive influence on the implementation's decision.
At the level of the technico-economical feasability study, it is important to estimate the wind potential of one site of implementation in order to define the characteristics of the wind turbine, but especially to establish its profitability in order to elaborate a business plan.
At this stage, the candidates for becoming a wind turbine operator submit to the authorities a proposal and request an offer to the manufacturers by themselves. A meteorological study has thus to be undertaken. In particular, a meteorological mast is put in place in order to place an anemometer at a given altitude and record during 6 month to one year the wind data. The wind potential is then deduced or extrapolated from the observation data analysis. If this analysis is conclusive, the implementation study can continue. Otherwise, another site will have to be found or the project cancelled.
The approach ATM-PRO proposes, aims to provide the keys to perform a pro-active prospection. This means search for potential operators located within an area identified as beeing a possible zone of implementation of a wind farm because of its good wind potential and its good energy production potential.
To achieve such an objective ATM-PRO proposes to use modelling tools, called "meteorological models". These models enable to simulate and study the air movements. Such models developed by ATM-PRO are adapted to local scales from few hundred meters up to few tens of kilometers. They are thus particularly suitable for wind potential assessment studies.
These meteorological models enable to:
- simulate the air movement over a large area and over long period of time (one year for example)
- simulate the vertical wind profile (speed and direction)
- assess the meteorological potential and the energy production potential at altitudes of interest for the wind turbine (e.g. 10, 30, 60 or 90 m)
The study will model at the local scale the wind potential taking into account the terrain complexity (topography and land use). It will use a grid mesh resolution of about 250 m. As an example, if a domain of interest extends over an area of 25 km x 25 km, this means there will be 10.000 simulated meteorological maps "equiped" with 4 anemometers placed, for example, at 10, 30, 60 and 90 m.
The analysis of the model results in terms of wind speed in particular will allow a realistic estimate of the energy production potential. This assessment would thereafter be used in order to develop a coherent wind turbine farm system over the area of concern.
The ATM-PRO method presents also other advantages with respect to observations performed using classical meteorological maps:
-
COST REDUCTION
- wind measurement at multiple locations over the area
- wind measurement at multiple altitudes
- wind measurement during at least one year
-
TIME SAVINGS
- modelling is "quick" (CPU and analysis ~ 3 months to model 1 year)
-
ACTIVE PROSPECTION
- dwind turbine possible implentation zone definition
- pre-assessment of the wind energy production
-
CREDIBILITY based on
- validated models
- best localisation optimisation process
The « approach » proposed by ATM-PRO... top
Since 1995, ATM-PRO develops and uses, within user-friendly and intuitive interfaces, advanced meteorological and pollutant dispersion models. These sophisticated tools enable to better understand the behaviour of the atmosphere of which depends the dispersion. In particular, the SEVEX and MAESTRO Tools/Software are specialized tools designed to assess the consequences and dangers resulting from a major chemical accident or for long term/chronic impact studies, respectively.
In the framework of the wind potential mapping over a given area, ATM-PRO proposes to use its MAESTROW software (i.e. the « WIND » module of MAESTRO).
The MAESTROW Softwaretop
MAESTROW is a meso-meteorological model adapted to determine the wind fields at the local scale (from few kilometres to few tens of kilometres with horizontal grid sizes from ~100 m up to 10 km). This model solves the air movement equations on a terrain following grid. It integrates data and models for the atmospheric transfer of solar radiation, energy balance and surface characteristics (like roughness, albedo, emissivity) in order to determine the dispersion potential of the atmosphere, the atmospheric turbulence and other parameters required for the dispersion modelling.
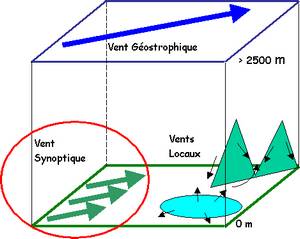
MAESTROW is forced by large scale wind/flow, which can be assessed by a boundary condition which is called « geostrophic wind ». The actual atmosphere, as well as the MAESTROW software, are « driven » by such large scale movements. It is thus important to find out meteorological data which are adapted to the model requirements in terms of large scale forcing. From this forcing, the model will calculate the « local » wind required for dispersion calculations. The here under scheme presents the connections between local, synoptic and geostrophic wind.
As an example, we provide hereafter results obtained (1) using a « large scale » meteorological model (resolution of 10 km which is about the « synoptic » scale) and (2) using the MAESTRO Tools using the previous results as forcing.
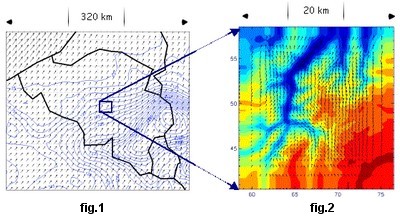 Figure 1 : example of meteorological field at the synoptic scale (resolution = 10 km x 10 km). The wind at 10 m is represented by the arrows which give the intensity (length) and direction (orientation) of the wind. The situation corresponds to 2/2/1999 at 20 h. The topography is shown as contour lines.
Figure 2 : example of meteorological field at the local scale (resolution = 250 m x 250 m). The wind at 10 m is shown. Colour contours provide the topography (blue = valley / red = top of the domain). The local deformation of air movement due to the topography is clearly shown.
Example : « Downscaling » of the higher resolution modelling in order to improve the understanding and simulation of the local effects of the topography and land use.
As an example of MAESTROW validation we provide hereafter results obtained from an application in Belgium . The forcing data were taken from a weather station (airport): FF, DD, T2, N, RH, RRR and PPPP as hourly data. The model has been applied during one year. On the domain, a local weather station exists and enables comparison between simulation and observation. This comparison provides correlation agreements of 87% on the wind speeds obtained and 83 % on the wind direction. These testify of the capability of the MAESTROW software to reproduce local winds on the basis of synoptic ones;
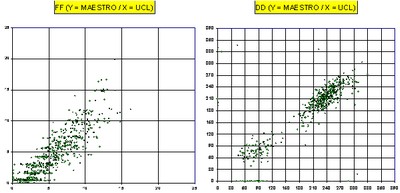 Note : the perfect agreement corresponds to the diagonal of the graph)
WIND POTENTIAL ON A GIVEN DOMAIN top
The various steps to perform a wind potential study are described hereafter, as well as the information that can be produced from the modelling.
1. Meteorological analysis
The territory is divided into zones of ~ 25 km x 25 km. A calculation grid for the meteorological variables is set up. Its resolution is 250 m x 250 m in order to estimate the wind potential at the local scale. This mesh is equivalent to a coverage of the domain by 10.000 meteorological masts.
The model grid enables also to estimate the wind at various altitudes. In what concerns the wind turbine positioning the interesting levels would be for example 10 m, 30 m, 60 m and 90 m.
For each grid point of calculation, the meteorological analysis consists, on one hand, to determine at each selected altitude:
- the wind frequency by wind speed classes
- the maximal wind speed (cf. building stability)
- the number of cut off hours of the wind turbine during the year (too weak wind or too strong wind)
- annual energy production potential with respect to altitude and wind turbine model
2. Definition and pre-selection of potential implementation zones
Based on the above analysis, the various zones where an wind turbine implementation is possible are determined.
These zones are represented on maps showing:
- windturbine energy production by unit of time
- number of cut off hours of the system and
- best wind turbine model to implement
ABOUT THE TIME REQUIRED FOR SUCH A STUDY ... top
The approximate CPU Time required to perform a complete cartography of the wind potential over a region of 25 km x 25 km on an annual basis is about 3 months.
top
Product of ATM-PRO sprl .