


Atmospheric dispersion model for denser-than-air releases
1. Introduction top
Emergency release model ideal for your 112(r) RMP Project.
The best tool to predict hazardous zone and potential impacts of accidental releases. Ideal for EPA’s Risk Management Plan (RMP) and to analyze emissions from accidental releases of toxic gases.
SLAB view can model continuous, finite duration, and instantaneous releases from four types of sources: a ground-level evaporating pool, an elevated horizontal jet, a stack or elevated vertical jet, and a ground-based instantaneous release.
2. Main Characteristics top
Some features that will save you a huge amount of time and hassle include :
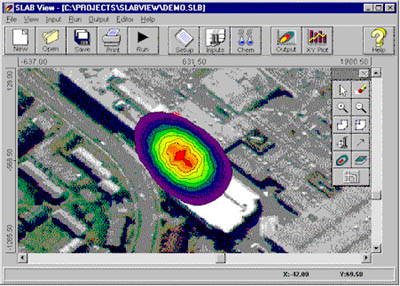
- SLAB view is an integrated modeling environment: intuitive data input, model run, and full featured post-processing with automatic gridding and contour plotting of your results. The graphical output can be directly pasted into your favorite Windows word processor.
- SLAB view comes with an extensive database of toxic materials that will save you time and make your modeling project easier. You can also easily add other chemicals to the database.
- You can display a site map as an overlay, in AutoCAD DXF, USGS DLG and LULC, and BMP formats to visualize your results.
- The SLAB view User’s Guide uses pictures and graphical information to assist you in quickly applying SLAB view to your best advantage. The graphical output capabilities of SLAB view can help you create impressive presentations of your model results. You can choose transparent contour shading, change fonts, annotate, specify optional wind direction, etc.
- The program checks valid ranges for all entry fields that will help save your time by reducing invalid entries. Before running your project, SLAB view displays a report of all missing information.
- SLAB view comes with a context-sensitive "Help that really helps", which provides you with a very clear explanation of the modeling requirements.
3. Description top
SLAB view is a complete graphical user interface for the SLAB model. SLAB is a dispersion model for denser-than-air releases, developed by the Lawrence Livermore National Laboratory, with support from the U.S. DOE, USAF Engineering and services Center, and the American Petroleum Institute. Due to copyright restrictions, the SLAB numerical code has to be downloaded from the SCRAM BBS or from our web site, FREE of charge: download the SLAB Model (FREE)
SLAB view provides an easy-to-use interface for describing the type of release that you are modelling. In addition to lots of tips and context sensitive help, SLAB view provides you with a set of Property Estimators that help take the guess work out of many of the input parameters.
Additionally, SLAB view comes with an extensive database of toxic materials that will save you time and make your modeling project easier.
SLAB view can produce XY plots that show the maximum concentration along the centre-line of the toxic release. These plots are fully customisable to allow you to change axis labels, fonts, colours and graph type.
The output can be customisable to allow you to enter your own title, your company name and place your own name on the printed output. SLAB view provides report quality output to a wide variety of printers and can be produced in both landscape and portrait formats.
The built-in print preview mode shows you exactly what your plot will look like before you print, saving you time, frustration and paper.
System Requirements
- A IBM or IBM-compatible machine and an 80486 processor or higher
- At least 8 MB of available hard disk space and 8 MB of memory (RAM)
- Windows version 3.1 or higher, Windows 95/98, or Windows NT
- CD-ROM drive (for installation)
4. SLAB approach top
Input Requirements :
- Spill Type - The model supports the following spill types: a ground level evaporating pool, an elevated horizontal jet, a stack or elevated vertical jet, and a ground-based instantaneous release.
- Source Properties - Define the properties for the material being released into the atmosphere: molecular weight, vapor heat capacity, boiling point temperature, heat of vaporization, liquid heat capacity, etc. SLAB view comes with an extensive database of toxic gases’ properties to be used with the SLAB model.
- Spill Parameters - Define the characteristics of the spill such as: temperature of the source material, mass source rate, source area, instantaneous or continuous source duration, and source height.
- Field Parameters - Define parameters related to the spill scenario site. These parameters are: concentration average time, maximum downwind distance, and heights of concentration calculation.
- Met Parameters - These are the meteorological parameters for the scenario you are modeling: surface roughness height, ambient measurement height, ambient wind speed, ambient temperature, relative humidity, and stability class.
- Footprints: You specify the concentration level and SLAB view will print a "footprint" for that particular concentration level. A "footprint" describes the total area impacted by the source material following up release. For a footprint, you can select the color, shading, and line style. | Footprint Results
- Puffs: After running the model, SLAB view displays all the available time-dependent puffs. A puff shows the area impacted at a particular point in time after the release. You can select from a list at which output time a puff should be displayed. From the Contour Options dialog, you can enhance the appearance of these contour puffs: | Puff Results | Change the contour levels to be displayed on the contour plots. Change the color and thickness of the contour lines and the color, font type, font size and display of the contour labels. Control the smoothing of the contour lines and the size of the contour mesh. Choose to shade the puff with color to show "hot spots" of high concentration.
- XY Plot: SLAB view automatically produces XY plots showing the maximum concentration along the footprint center-line. SLAB view has a complete graphics package built-in.
- For quality report presentation, you can print footprints and puffs with the overlay site map using SLAB view project templates. With these templates, you can print your company name, your name, date, modeling options, title, levels of concentration, etc. This way, you have the basic information of the printed results right on paper. If you want to paste your results into your report, you can also copy the contents of the drawing area to the clipboard and paste it into your favorite Windows word processor.
top
Product of Lakes Environmental Software Inc.